Data Visualization Solutions
Nautilytics specializes in custom data visualization solutions that transform complex datasets into clear, compelling visuals — built for the web, designed for decision-makers.
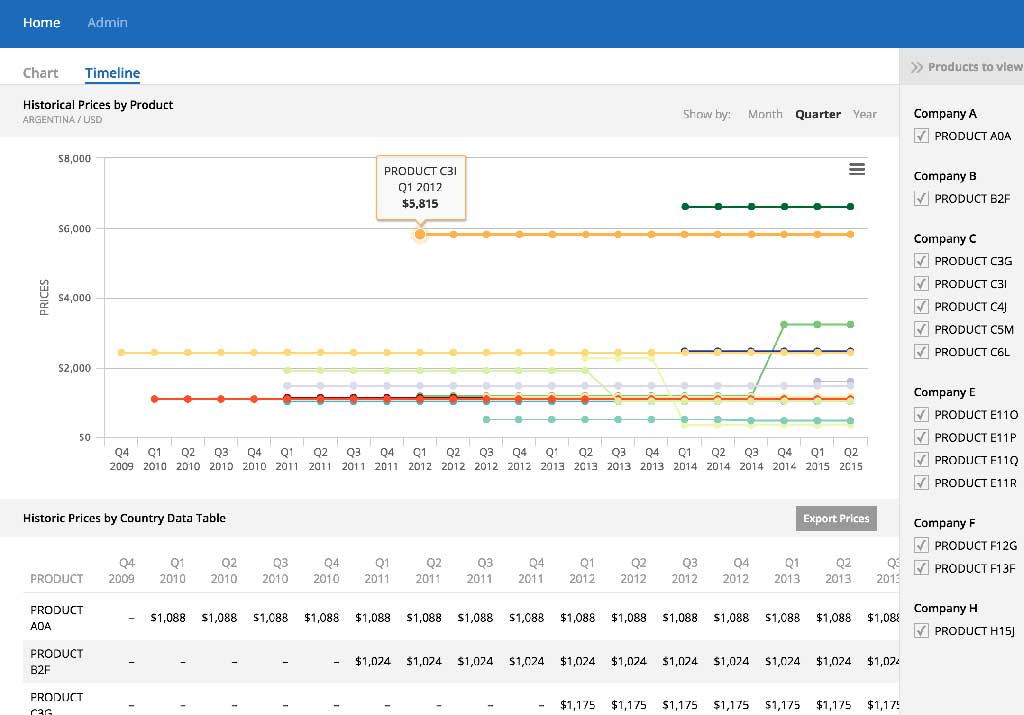
Data Driven Web Apps
Big Data & Visualization
We build custom web applications that surface insights from large datasets through interactive charts, dashboards, and real-time visualizations.
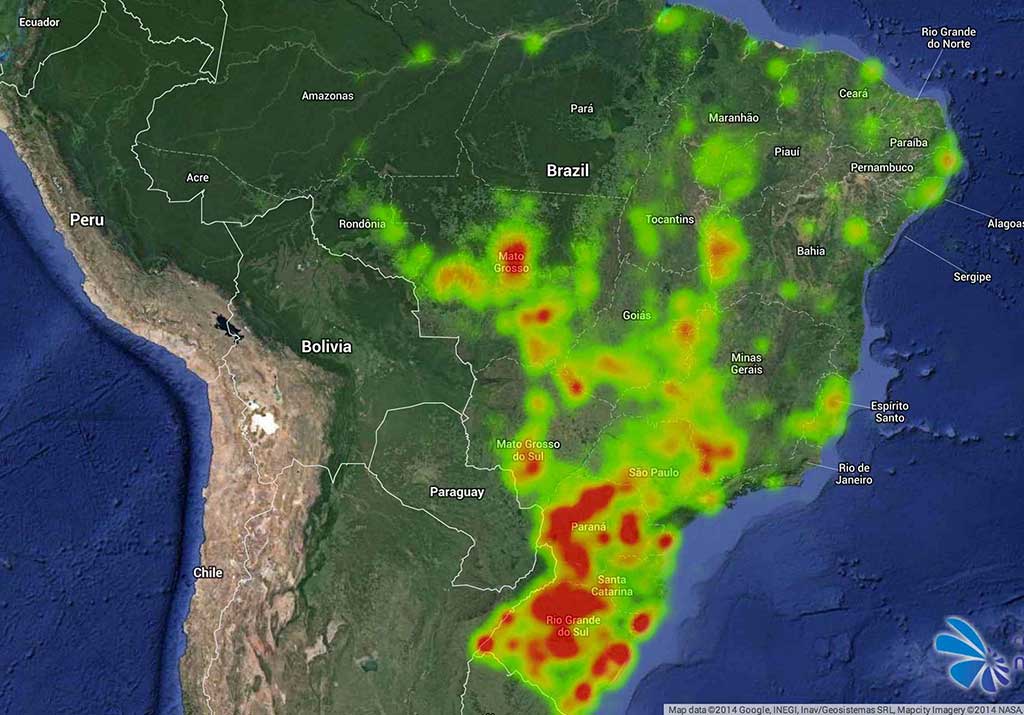
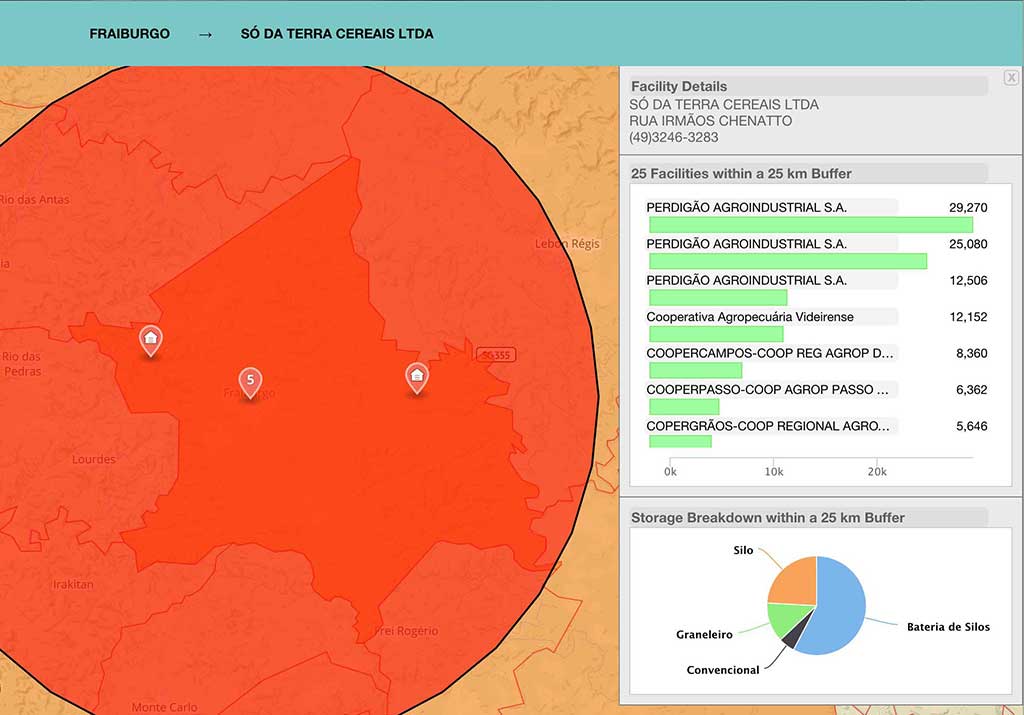
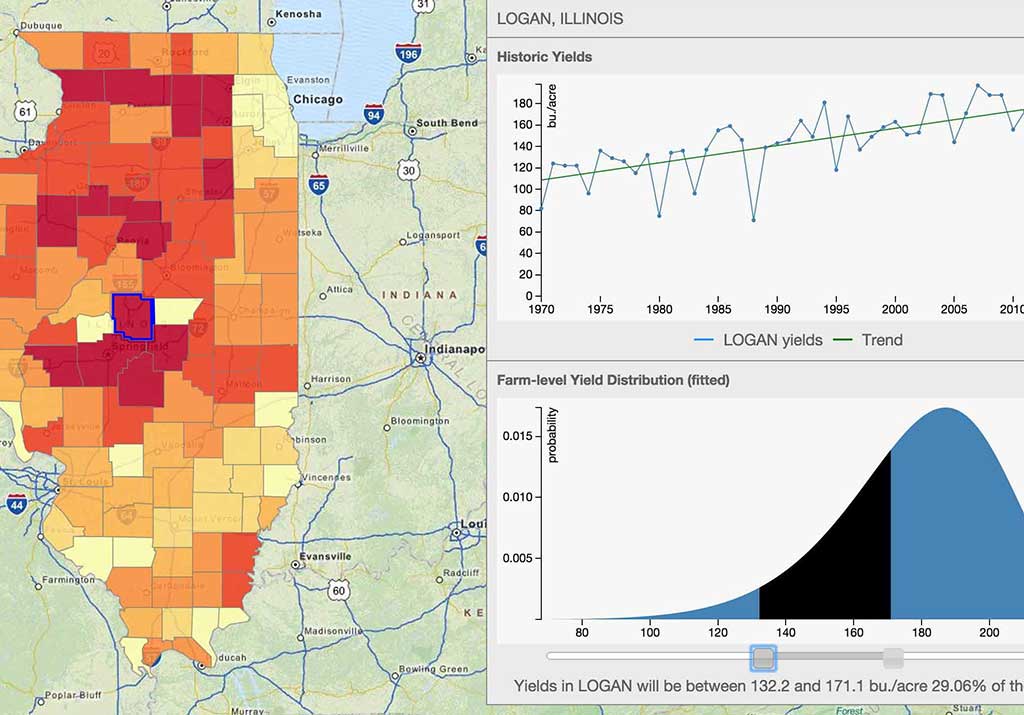
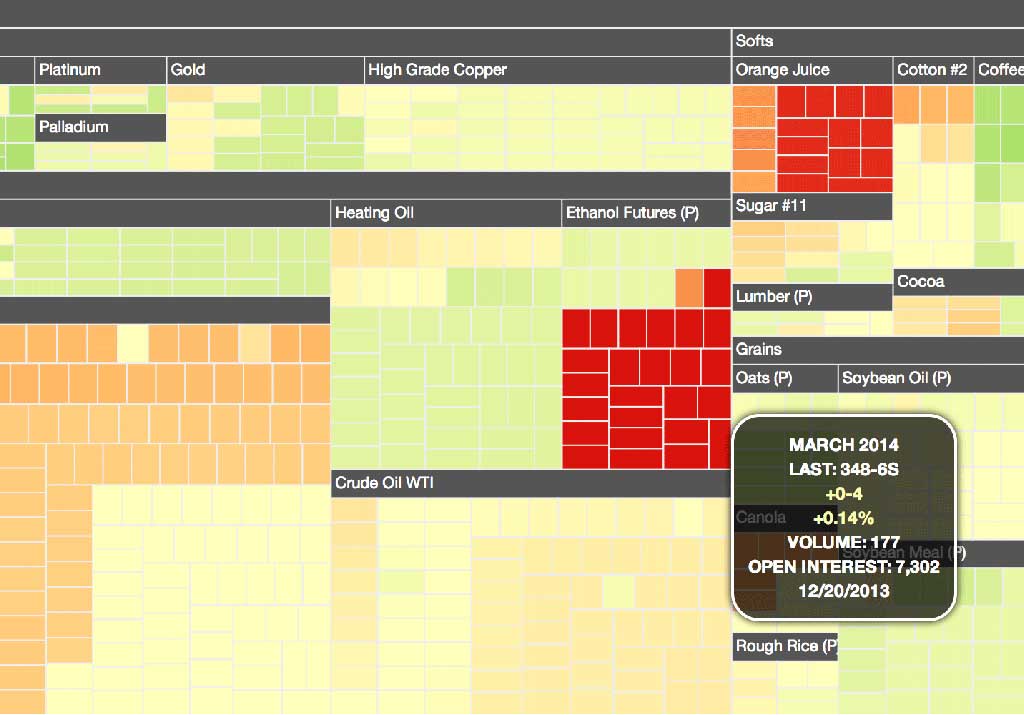
View ExampleInteractive GIS Solutions
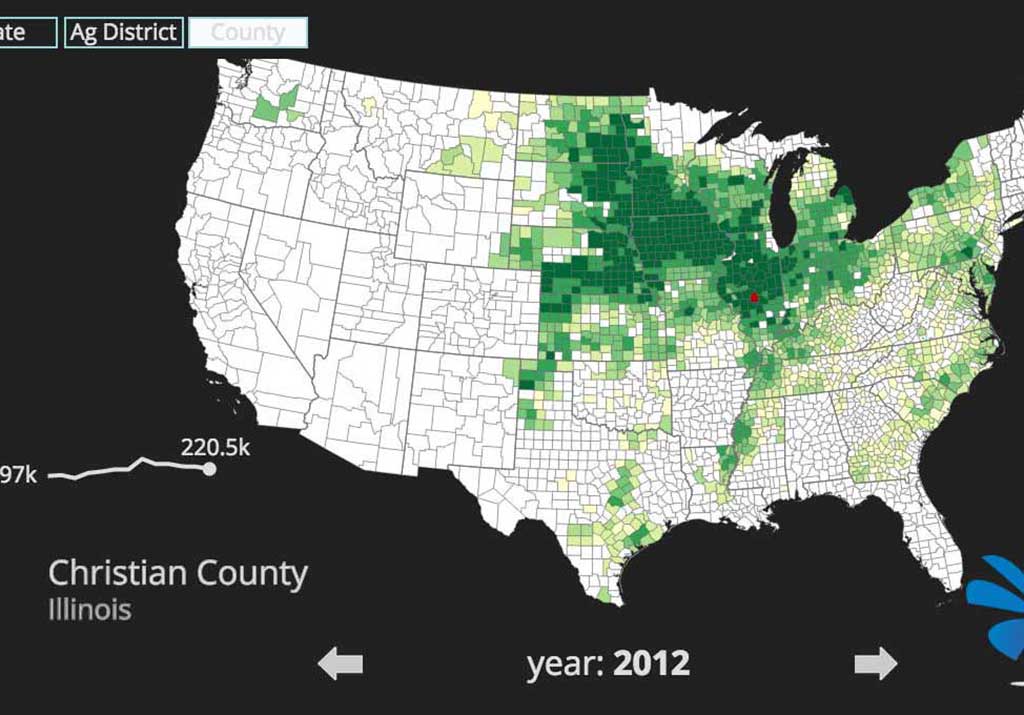
Next Generation Mapping Apps
From heatmaps to choropleth maps to tile servers, we create geospatial applications that make location data intuitive and actionable.
View ExampleExcel to Cloud Conversion
Break Free from Excel's Limitations
We migrate spreadsheet-based workflows into scalable, collaborative cloud applications that grow with your organization.
View ExampleCrowdsourcing Databases
Extending Data Collection
We design and build crowdsourced data collection platforms that harness the power of community to aggregate and enrich datasets.
Our Clients
Test Drive Our Portfolio
Explore a selection of interactive visualizations and web applications we've built for clients across industries.
Nautilytics & PIERS Product Suite
In strategic partnership with PIERS — the leading provider of US import and export trade data — Nautilytics has developed a suite of products built on decades of trade intelligence.
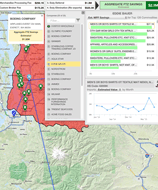
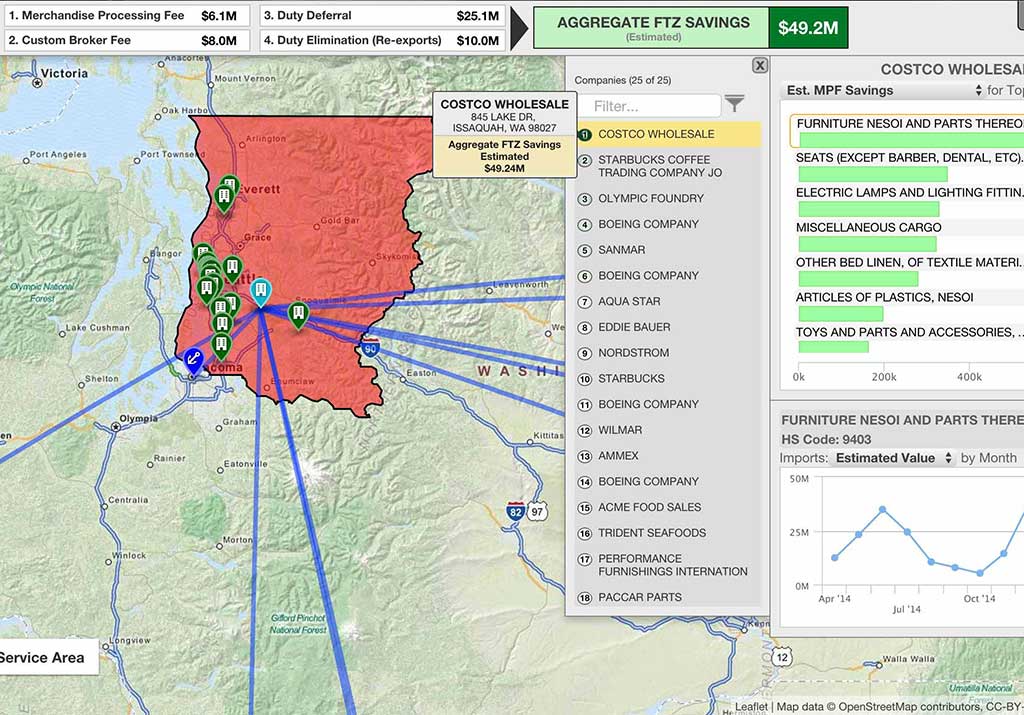
FTZ Official™
Highlight savings on over 5,530 imported commodities from 300k+ companies. Identify Foreign Trade Zone opportunities and calculate duty savings with precision.
View Case Study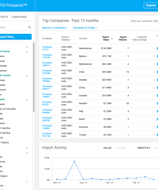
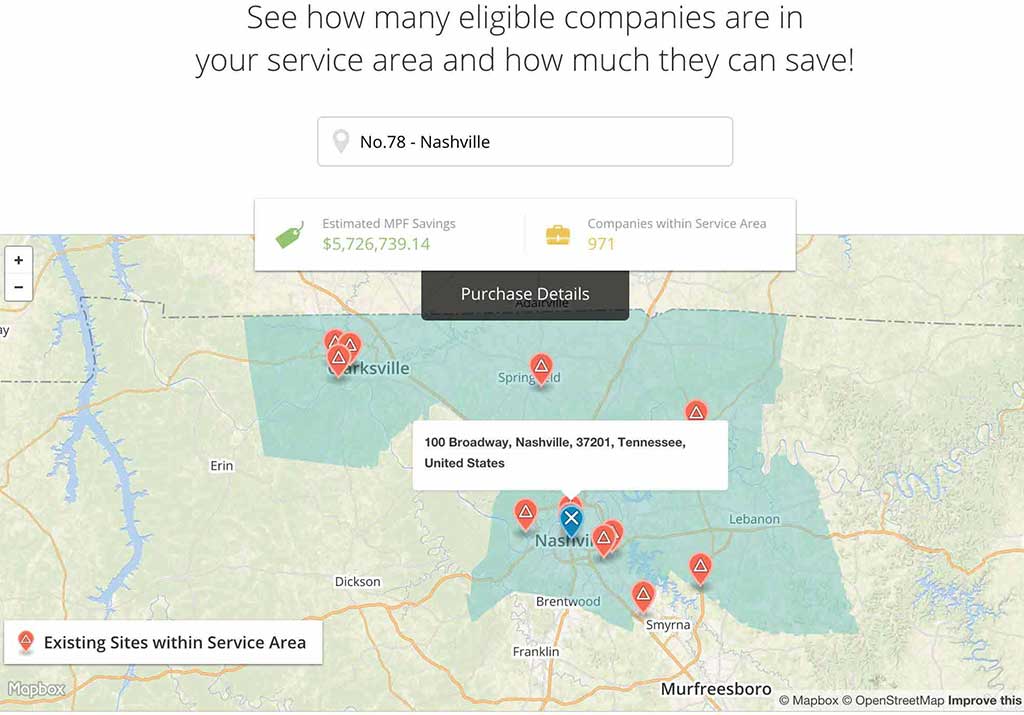
FDI Prospects™
Identify key suppliers and increase employment in your area by targeting high-impact foreign direct investment opportunities with data-driven site selection tools.
Get In Touch
Ready to transform your data into something extraordinary? Let's talk.