Case Study
Tradenet
A visual interface for mapping global agricultural trade networks
Considering Trade Relationships
Global agricultural trade is extraordinarily complex. FAOSTAT tracks 425 distinct agricultural commodities traded between 200+ countries — generating hundreds of thousands of bilateral relationships that shift annually. Understanding where opportunity lies within this complexity requires more than spreadsheets.
Tradenet was built to make that complexity navigable — giving trade analysts, government agencies, and agribusiness professionals an immersive, intuitive way to explore global trade data.
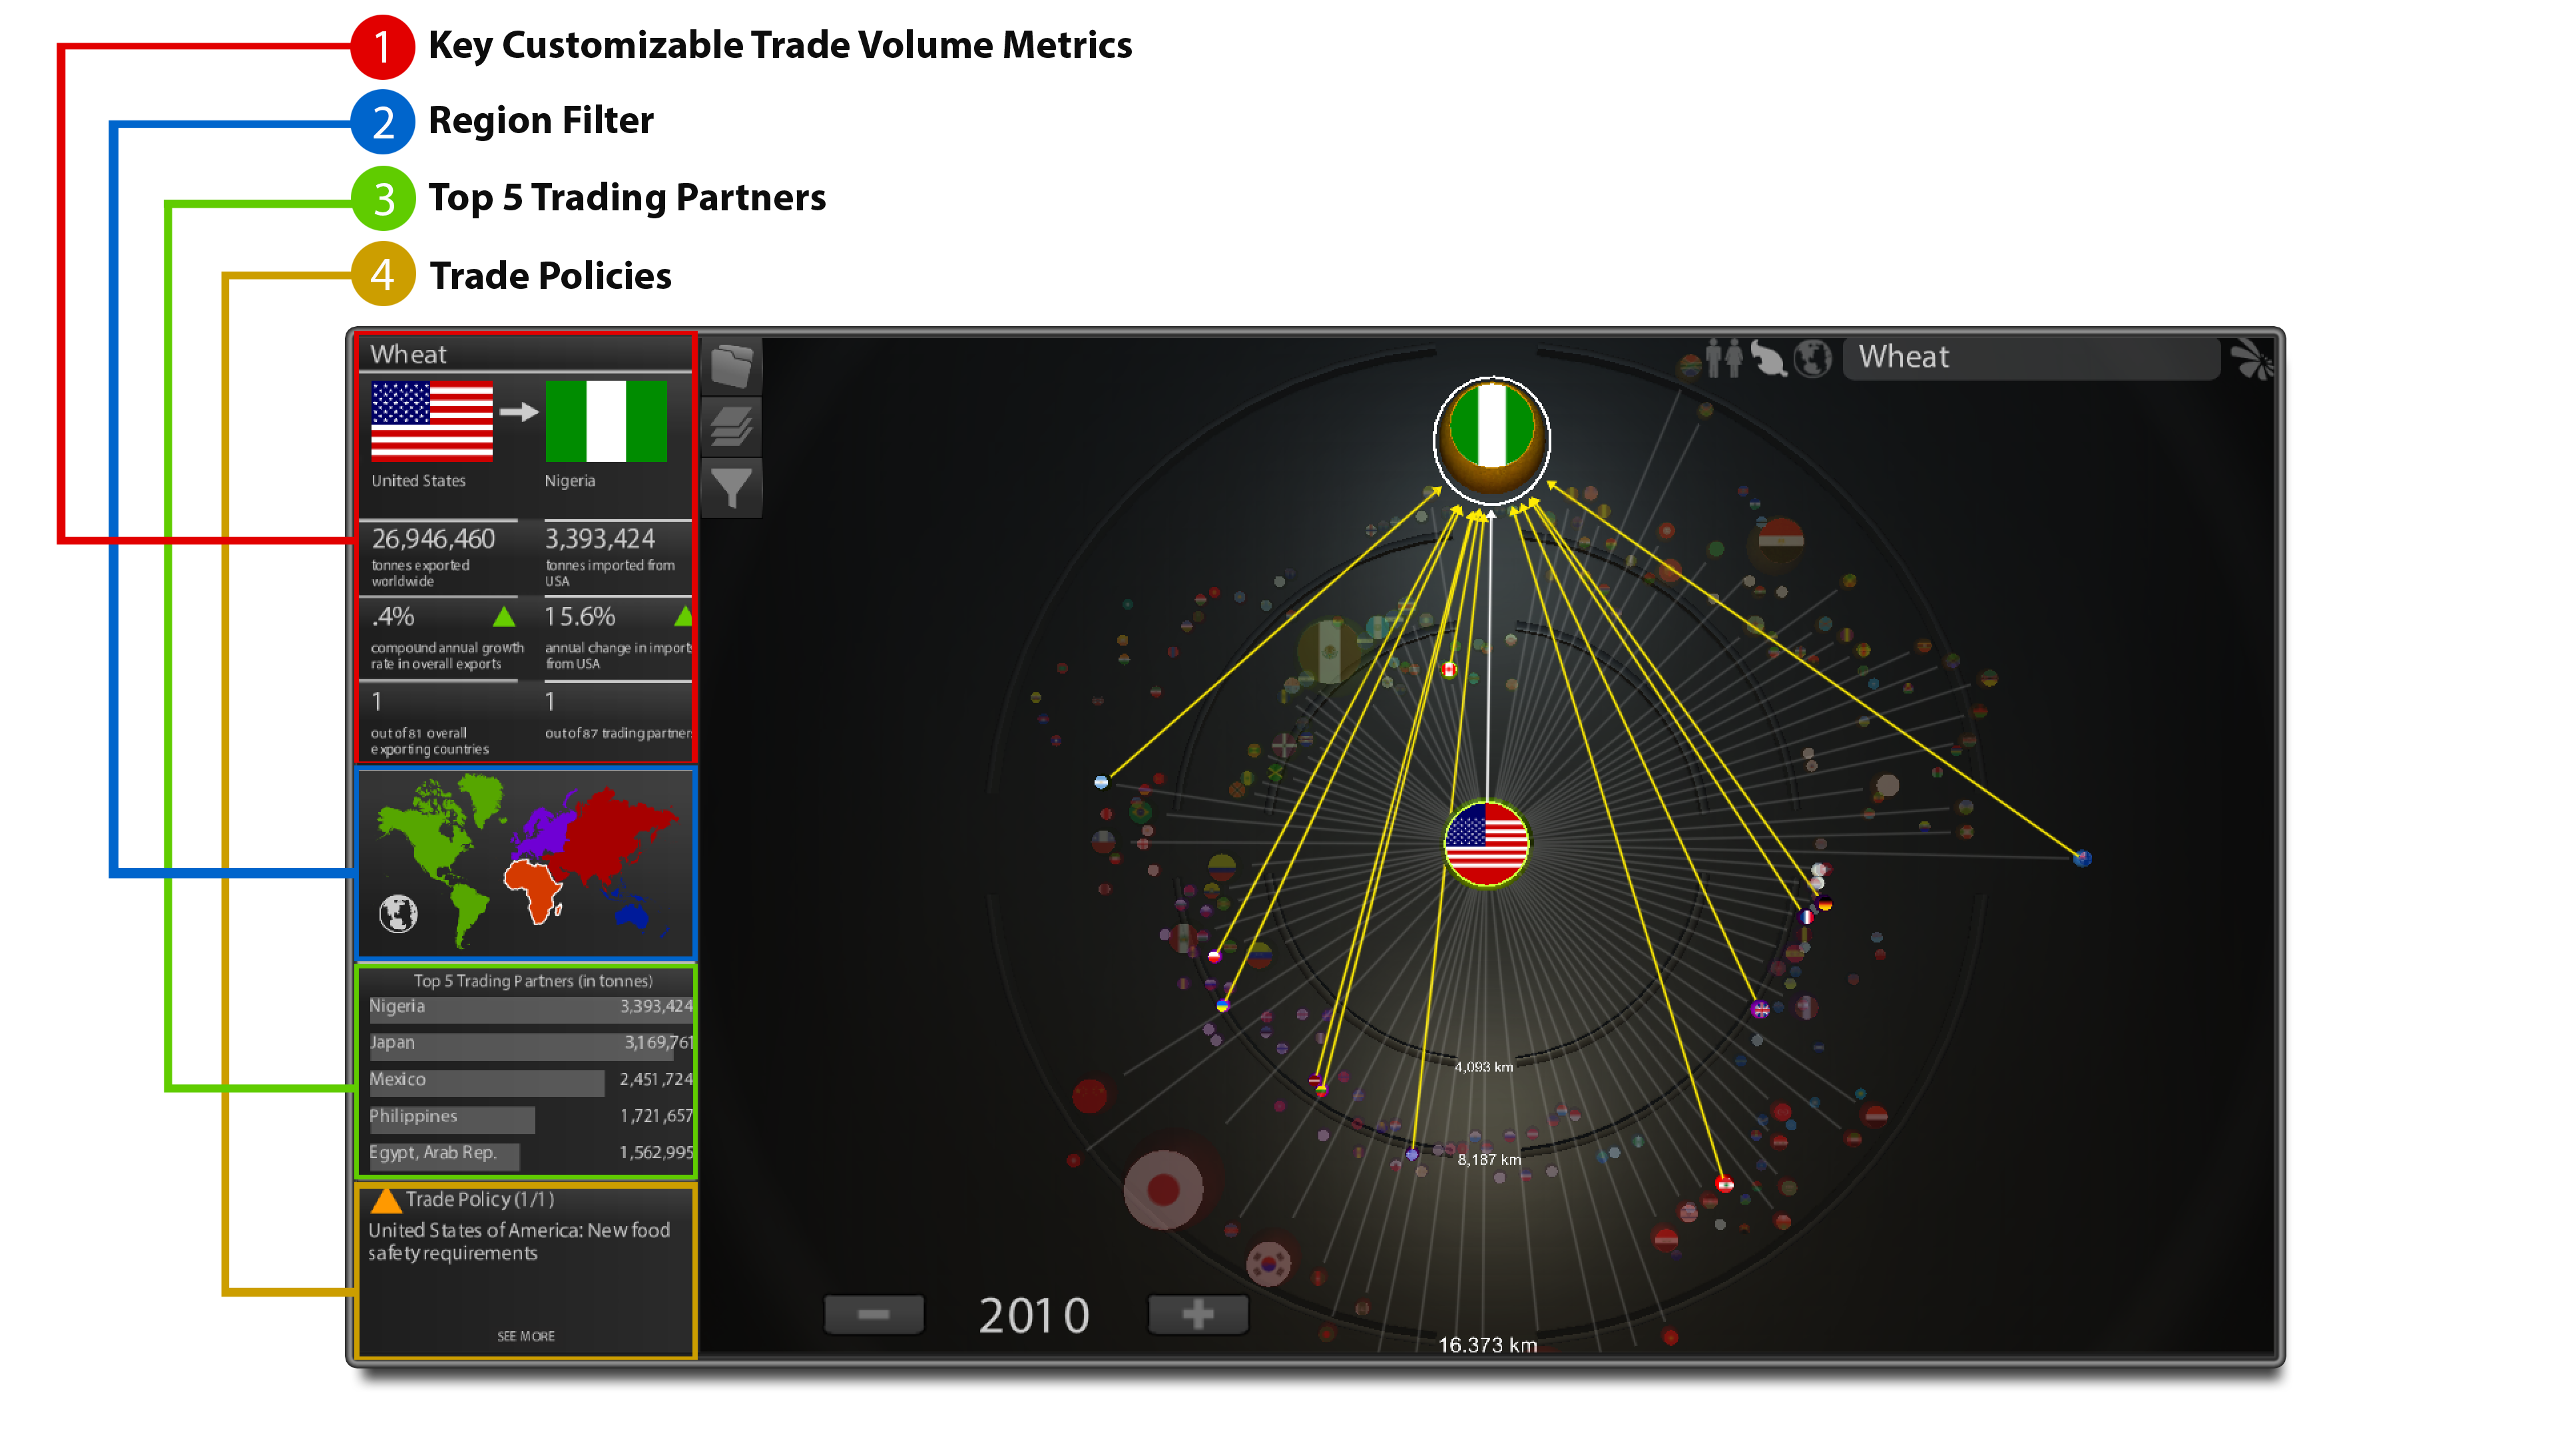
Analyzing Opportunity
One-click targeting surfaces the most relevant trade relationships for any given commodity and country pair. Current data retrieval ensures analysis reflects actual market conditions.
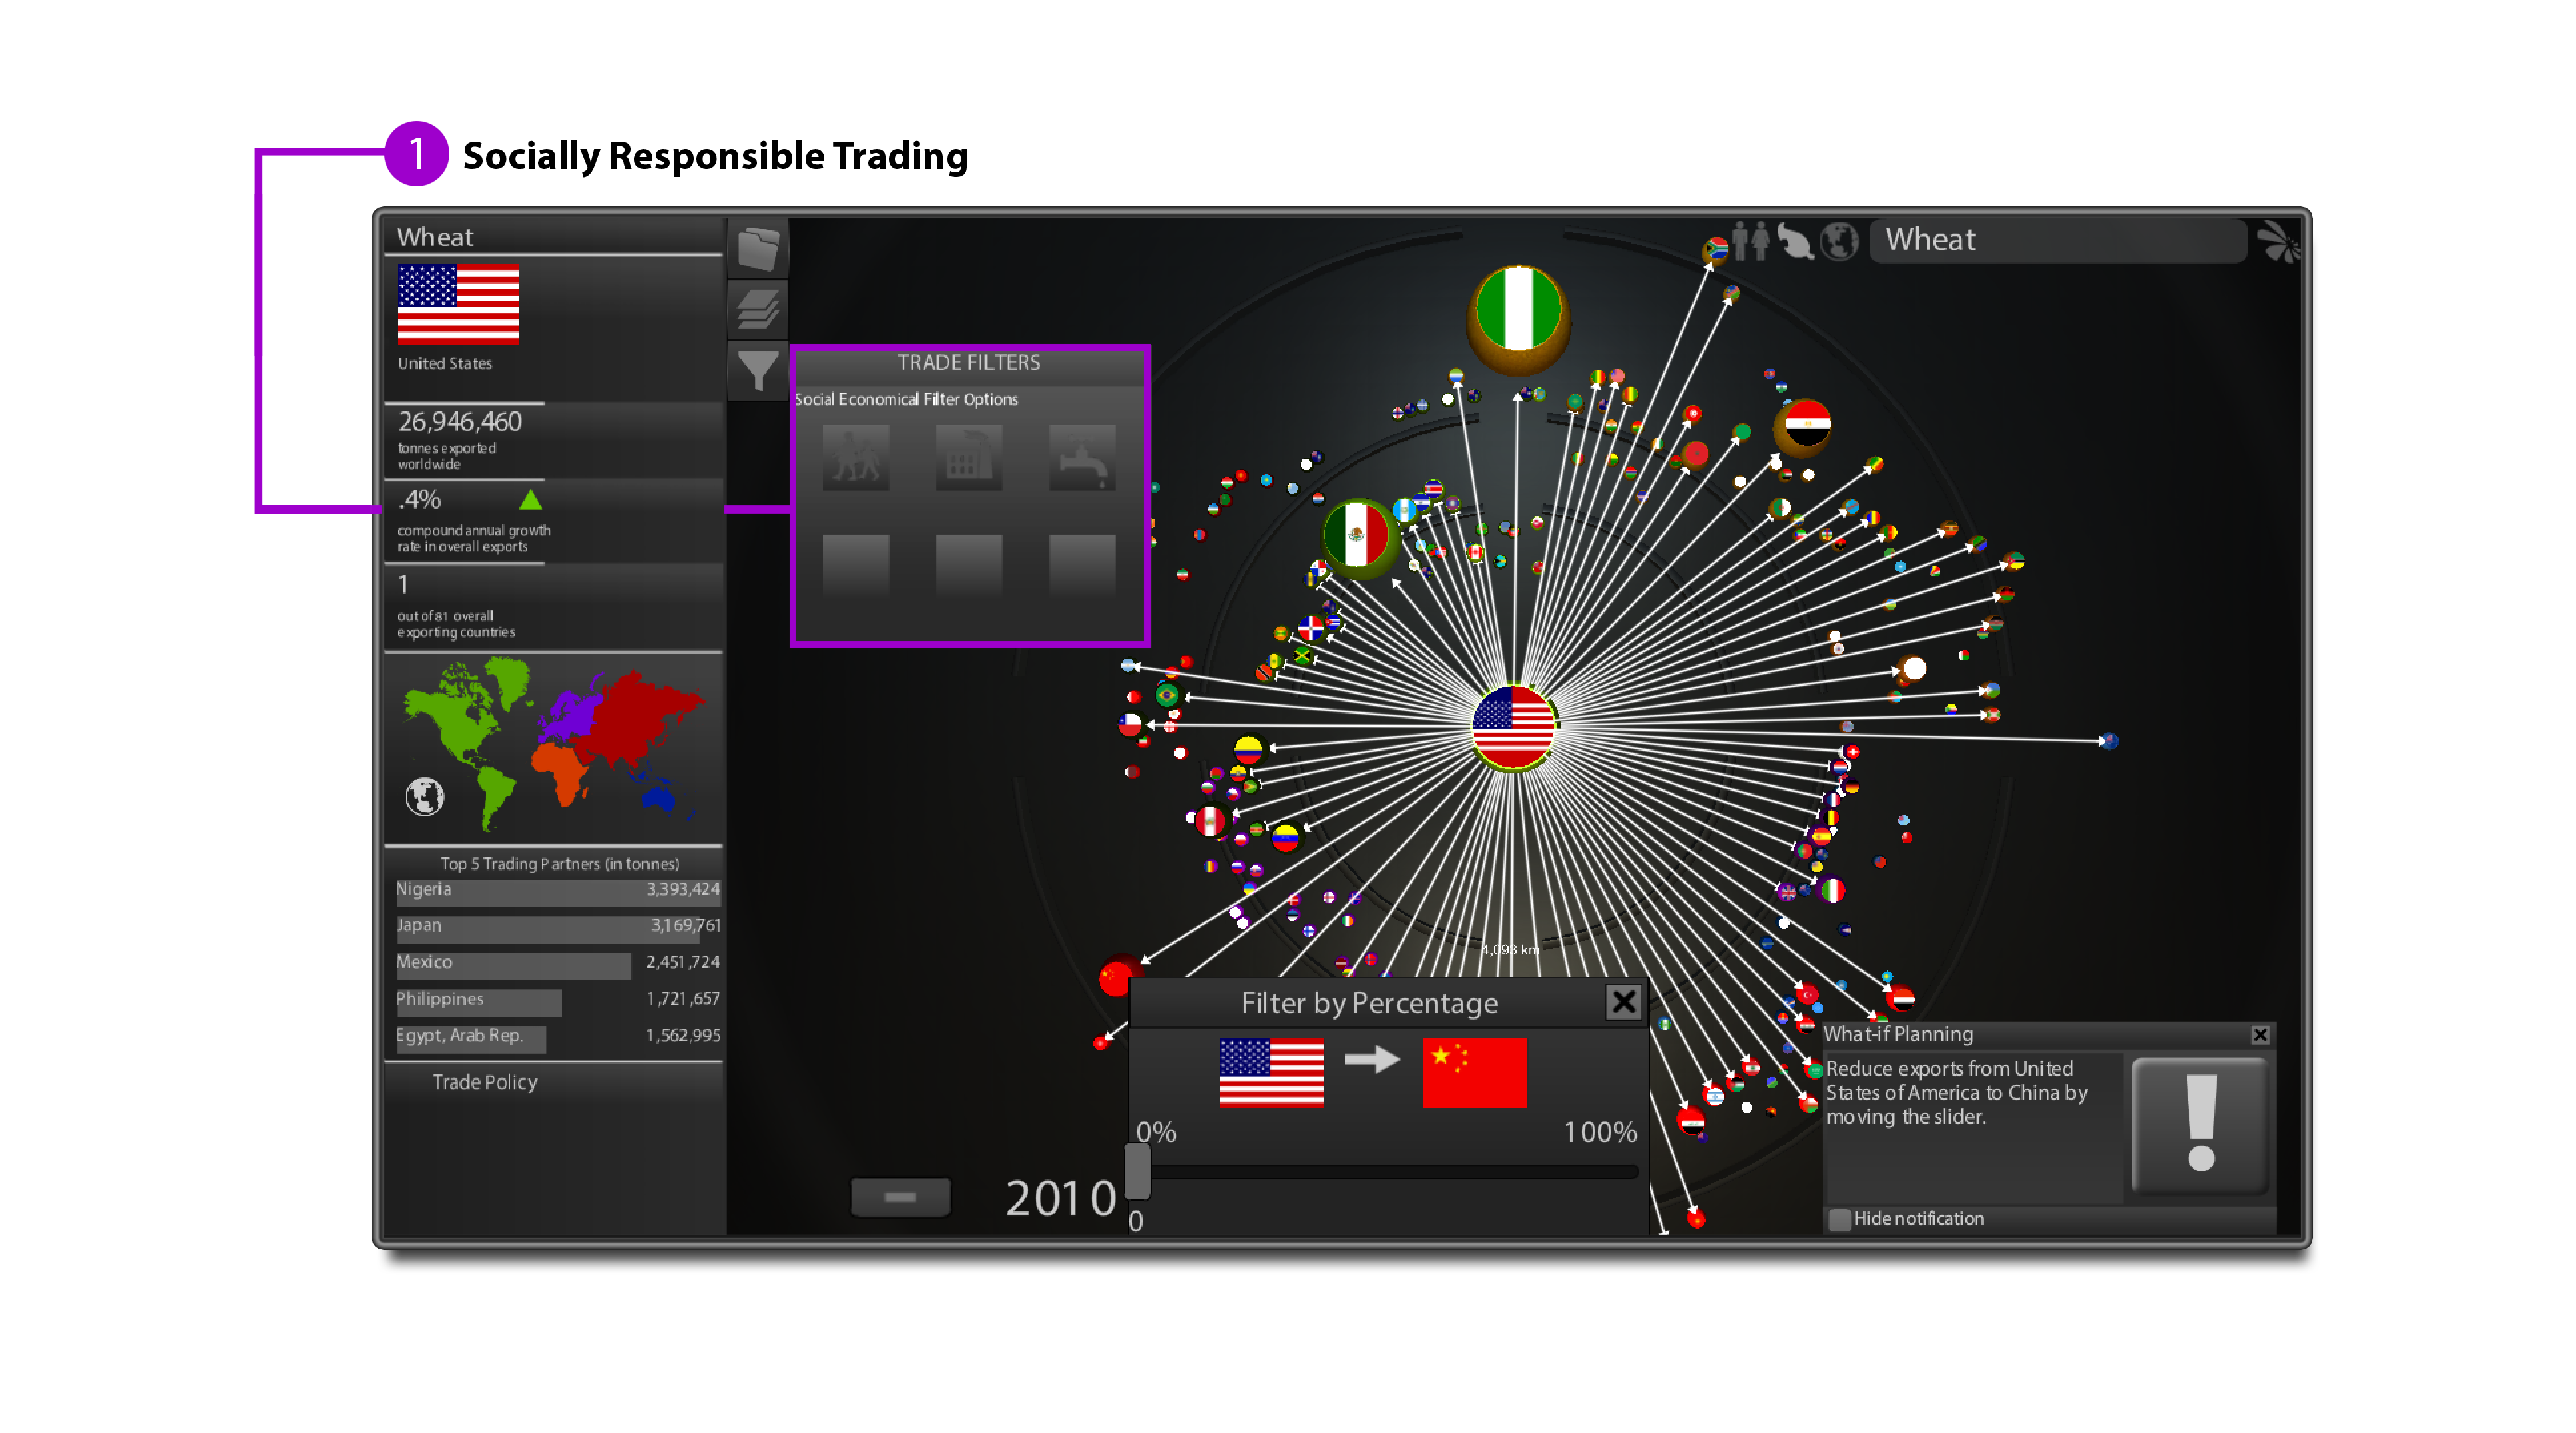
Secondary Due Diligence
Filter potential trade partners on human rights records, environmental standards, and food safety compliance — integrating non-financial risk factors directly into the analysis.
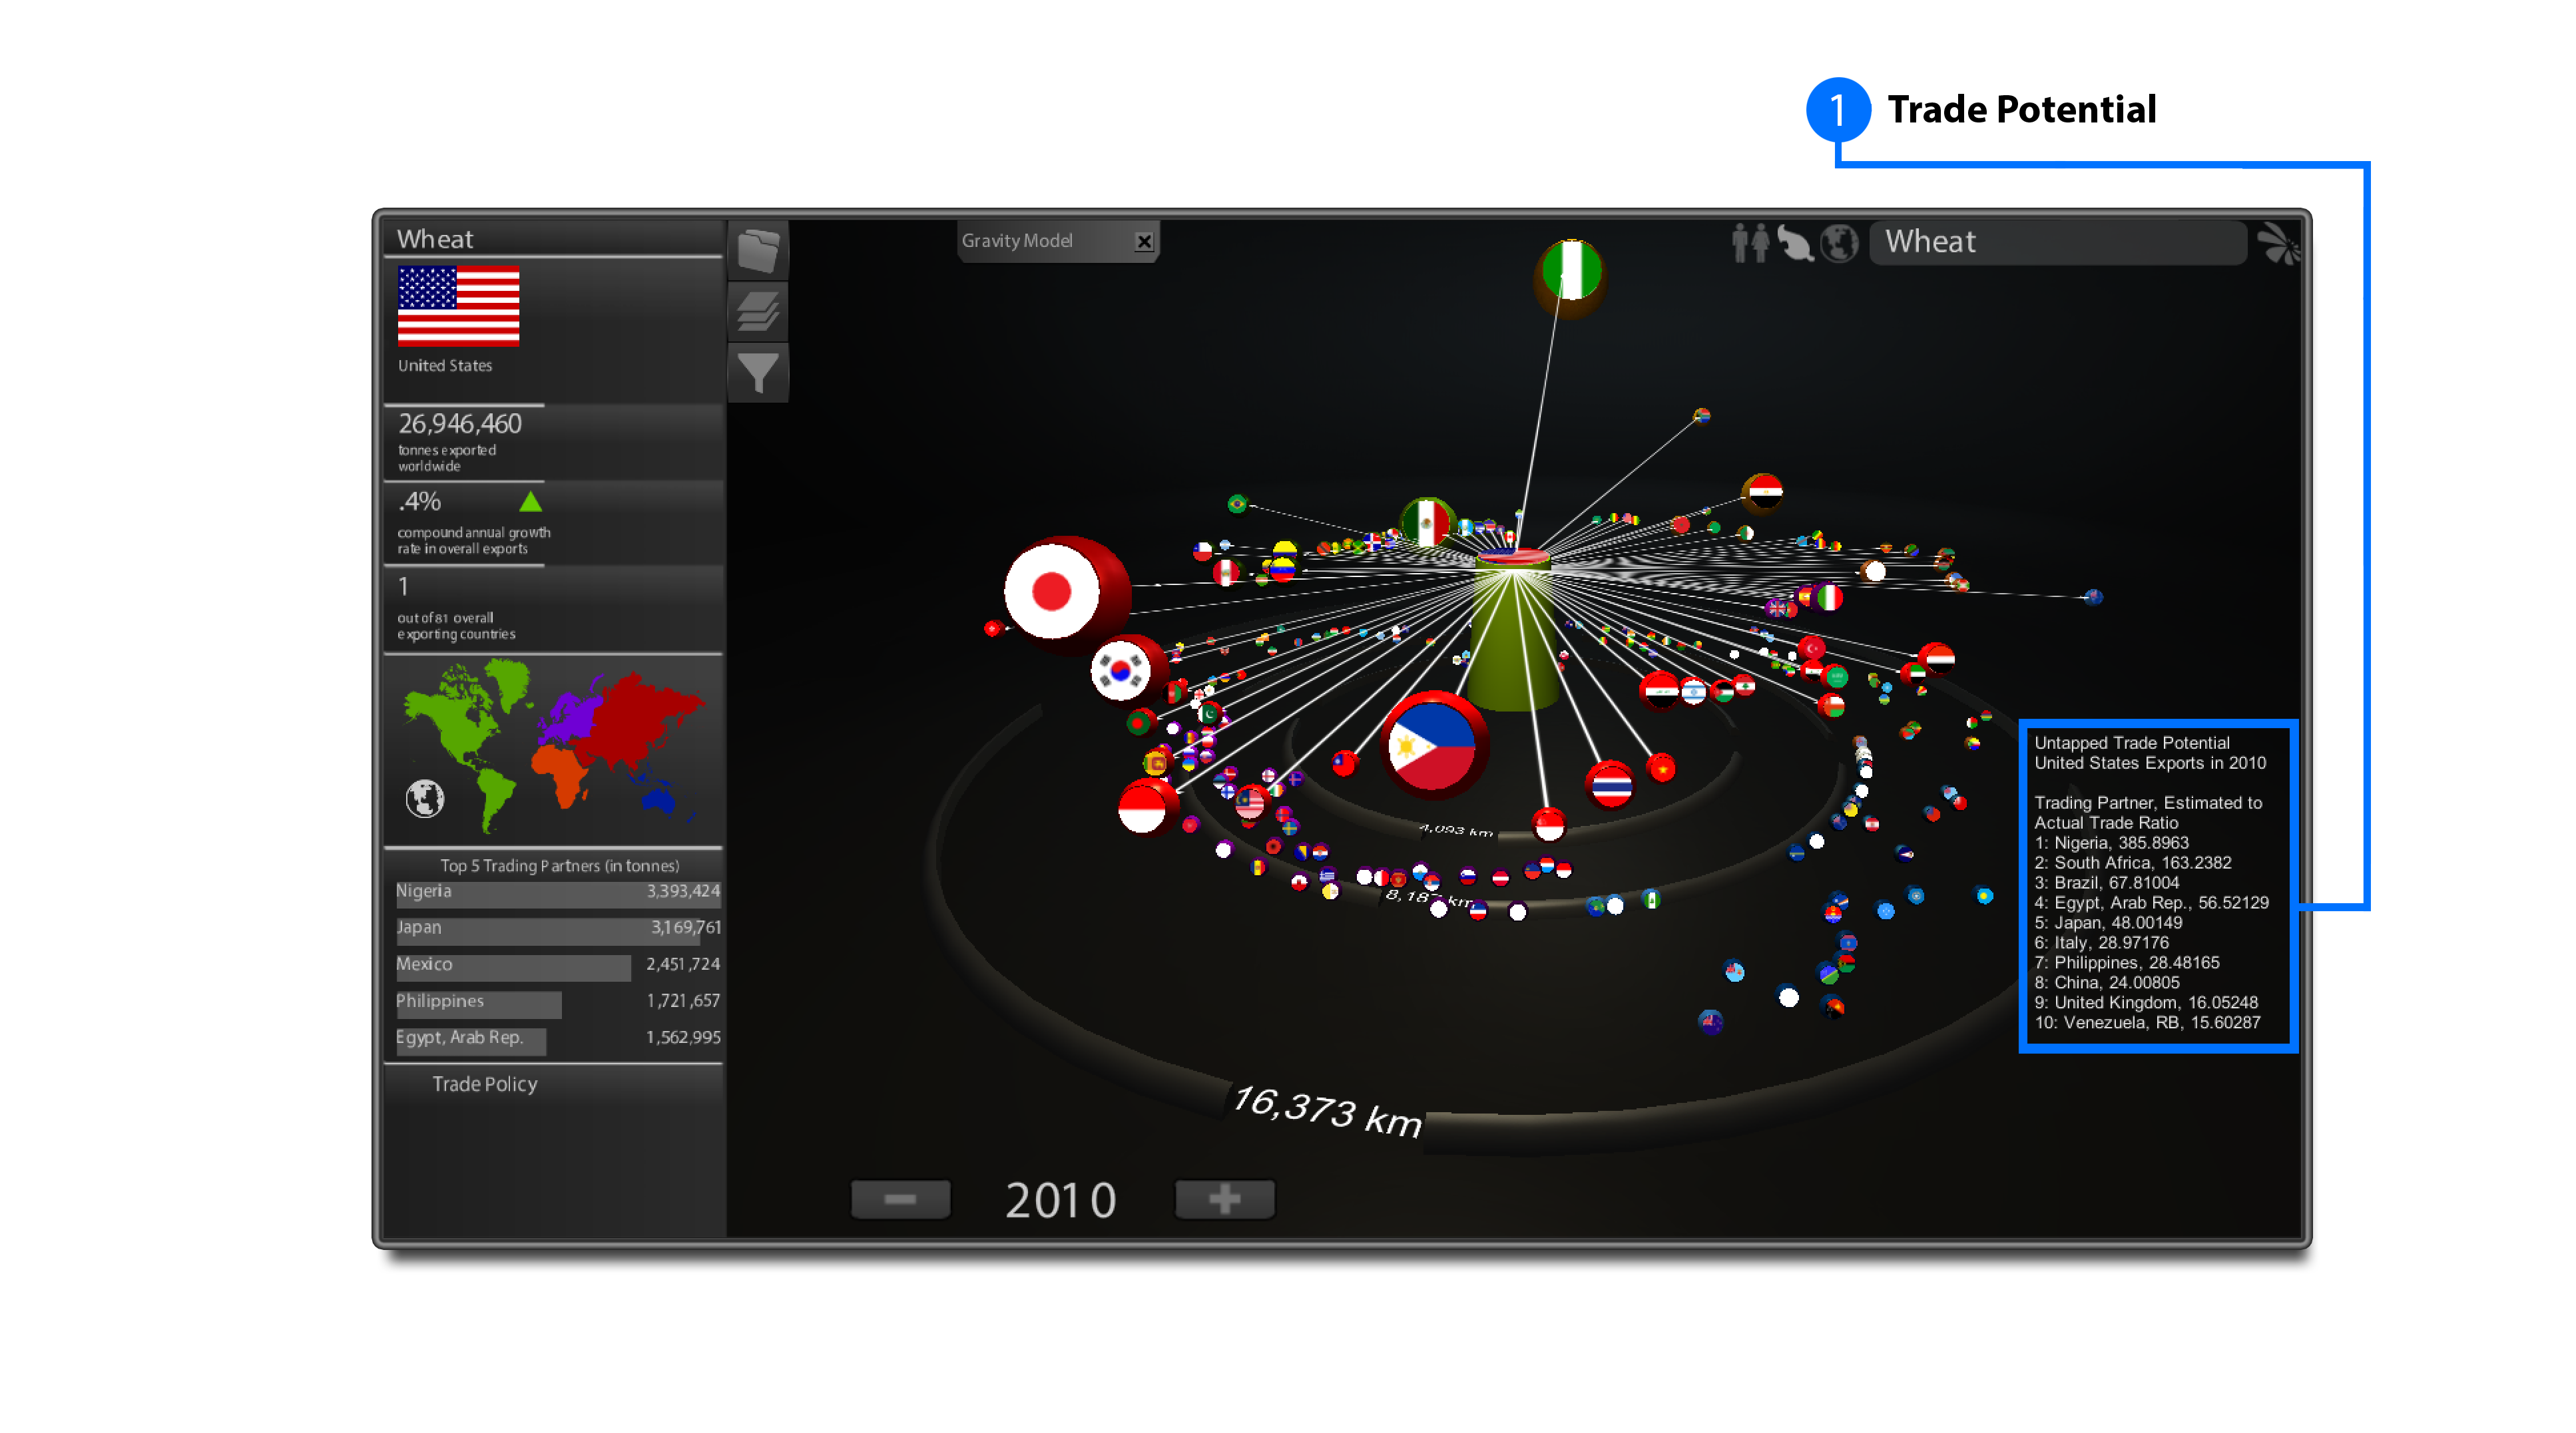
Untapped Trade Potential
A proprietary regression algorithm identifies commodity markets where trade volumes are significantly below their predicted potential — surfacing hidden opportunities before competitors.
Key Features
- Immersive 3D trade network environment
- Up-to-date global commodity data (425 agricultural commodities via FAOSTAT)
- Proprietary data integration capabilities
- Single-click bilateral relationship views
- Real-time trade alerts
- Fact-based report generation
- Desktop and web deployment options