Case Study
Running Route Tile Server
Collating millions of geospatial datapoints to illuminate popular running routes
Illuminating Popular Routes
WalkJogRun is an iOS GPS running app with a large and active community of runners who track their routes. In 2013, the company approached Nautilytics with a question: where do our users actually run?
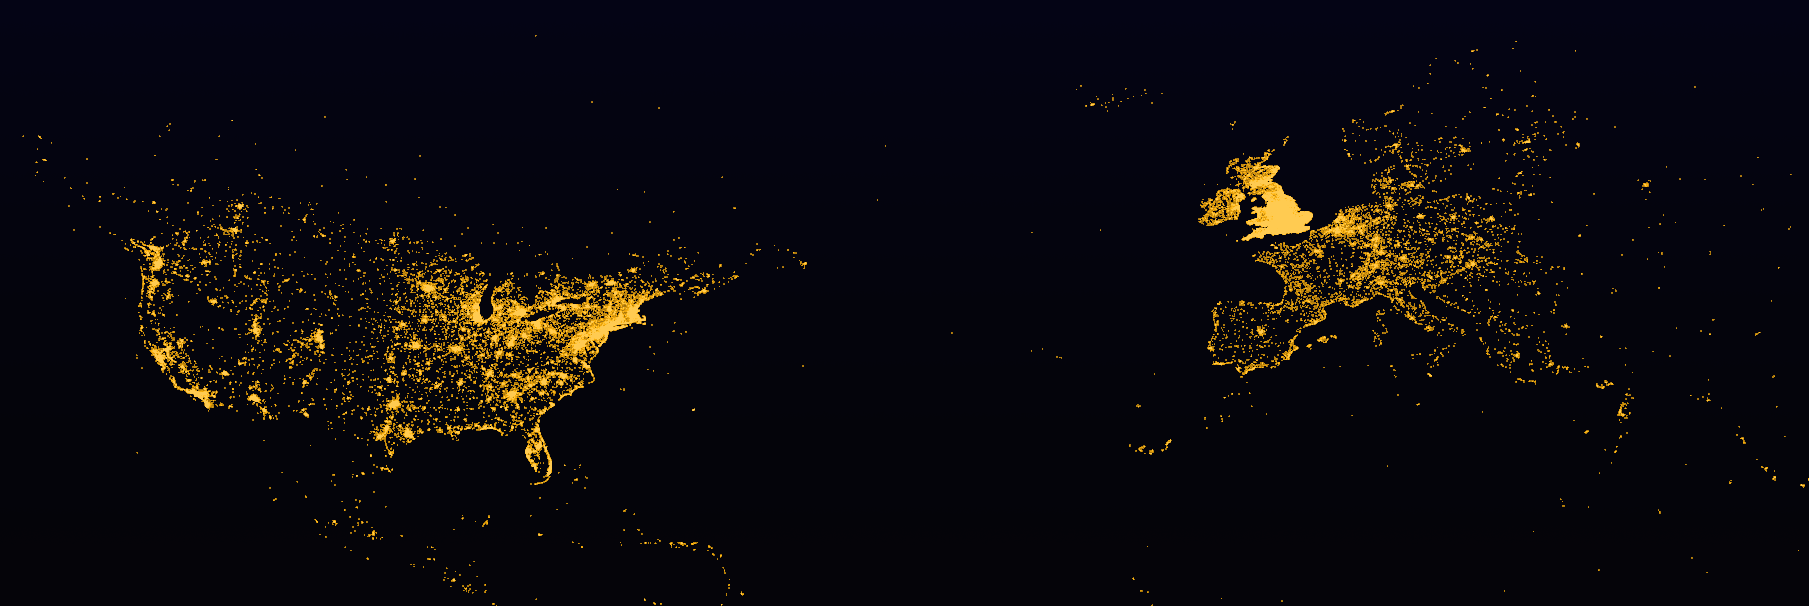
Nautilytics processed over 125,000 GPS-tracked routes — millions of individual geospatial datapoints — and rendered them as a dynamic route density visualization. The result showed exactly which roads, paths, and trails attract the most runners across the country.
The project was featured on Flowing Data, one of the leading data visualization blogs, driving significant attention and user growth for WalkJogRun.
Interactive Analysis
Beyond the static visualization, Nautilytics built an interactive tile server — a live, zoomable map that let users explore route density at any level of detail, from city-wide patterns down to individual street segments.
Interactive route density map — zoom in to explore popular running routes
Benefits for Runners
Safer Routes
Popular routes signal well-lit, trafficked paths that other runners trust.
More Scenic
Community-preferred routes often align with parks, trails, and green spaces.
Less Polluted
Density data helps runners avoid high-traffic roads in favor of cleaner air.
Client
WalkJogRun — iOS GPS running app and community platform
Project Stats
- 125,000+ GPS-tracked routes processed
- Millions of geospatial datapoints
- Featured on Flowing Data
- 2013